
Bitcoin is entering a pivotal moment in its 2025 market cycle. After slipping nearly 4% within 24 hours and rebounding above $102,000, the world’s leading cryptocurrency is flashing several signs that suggest a potential bottom could be forming. Although BTC is still carrying a monthly decline of nearly 10%, the recent convergence of technical indicators, on-chain signals, and long-term structures has analysts watching closely for a possible major reversal.
For now, Bitcoin remains inside a long-standing ascending channel that has guided price behavior since April. The latest rebound from the channel’s lower boundary has preserved this bullish structure, providing market participants some hope that the broader trend remains intact despite the recent volatility.
Rebound at a Critical Technical Level
On November 4, Bitcoin once again touched the lower trendline of its ascending channel and immediately bounced upward. Historically, this trendline has acted as a reliable support area for more than half a year. When bottoms form during rising channel movements, the lower boundary is often the first place where renewed strength appears.
The current bounce reflects the same pattern seen during previous cycle reset points. However, whether this reaction marks a true trend reversal depends on what comes next — specifically, whether Bitcoin can push through the next major resistance level blocking its path.
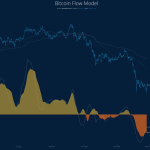
NUPL Revisits Historical Bottom Territory
A key on-chain indicator supporting the bottom thesis is the Net Unrealized Profit/Loss (NUPL) metric. NUPL recently dropped to around 0.44 — a zone that historically coincides with strong bottom formations. The last time NUPL hit similar levels was on April 8, when it fell to 0.42. From that point, Bitcoin surged more than 53% in the following weeks, climbing from about $76,700 to over $116,900 by late May.
This creates a compelling parallel: once again, Bitcoin is bouncing near the lower end of its ascending channel just as NUPL dips into its traditional bottom zone. Such alignments are rare and often precede noticeable market reversals. Analysts view this cluster of signals as more convincing than anything observed in recent weeks.
Still, while this setup lays the groundwork for a recovery, Bitcoin faces one major obstacle directly ahead — a powerful supply cluster that is blocking its path to a new uptrend.
The Cost-Basis Barrier That Could Prevent a Breakout
Bitcoin’s cost-basis heatmap highlights price levels where large groups of holders originally bought their BTC. These levels create pockets of supply that can block upward movement. One of the biggest clusters currently sits between $109,895 and $110,192, representing more than 117,000 BTC.
This is the “ridge” Bitcoin must clear before a true recovery can begin.
Notably, this resistance band also aligns with the 0.618 Fibonacci retracement level at $109,683 — often considered one of the most important resistance lines in technical analysis. As long as Bitcoin remains below this zone, every bounce carries a higher chance of failing.
To confirm a breakout from the bottom, Bitcoin needs a daily close above $109,683. A more secure confirmation comes at $112,652, which corresponds to the 0.786 Fibonacci level. If BTC pushes beyond these barriers, price targets expand rapidly toward $116,435 and potentially re-test the previous peak near $126,301.
What Happens if Bitcoin Fails to Break Resistance?
Despite the encouraging bottom signals, the market is not yet out of danger. If Bitcoin fails to break through the cost-basis wall and falls again, traders will look to the lower boundary of the ascending channel for the next reaction.
A retest of that boundary would keep the bullish pattern intact. However, a breakdown below the channel would invalidate the bottom formation and shift sentiment significantly.
In that scenario, Bitcoin could slide toward $98,758 — a level that has provided support in the past. A deeper drop below that threshold could weaken the entire long-term setup and raise the risk of a more extended correction.
Market Structure Still Shows Strength
Despite the near-term pressure, Bitcoin’s broader structure remains healthy. The ascending channel continues to guide price action, while on-chain metrics reflect long-term resilience. Holder behavior also aligns with bottom formations: long-term investors remain largely unmoved, while short-term traders have shown more nervousness during recent dips.
Additionally, macro sentiment around digital assets remains positive. Institutional investment continues to expand, regulatory clarity is improving, and global demand for Bitcoin as an alternative store of value remains strong.
The Path Ahead: One Barrier Determines the Trend
At the moment, Bitcoin’s fate hinges on one key level. Market indicators suggest that a bottom may be forming, but until BTC clears the major supply zone near $109,683, the trend cannot shift decisively upward. Traders are watching this threshold closely, as any move above it could ignite a push toward new highs.
For now, Bitcoin is staring at its next peak from below — but one major level still blocks the view.
Post Views: 3